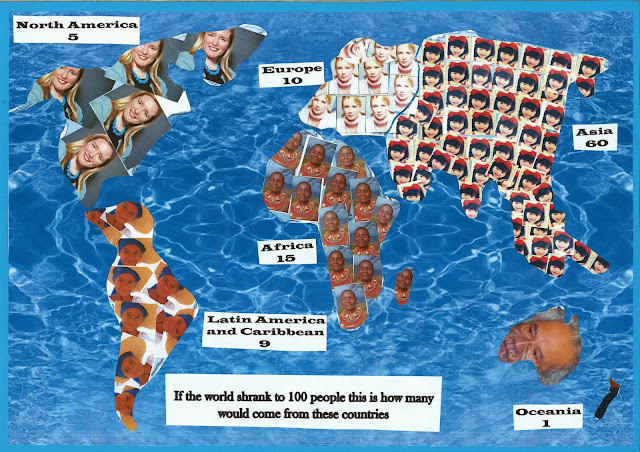
We have been looking at the purpose of statistics and that how statistics are displayed affects how they are interpreted and 'listened to'. We viewed lots of interesting and creative displays of statistics and then we got creative and looked for powerful ways of displaying some statistics. The statistics we used were of if the world was shrunk down to a village of just 100 people, what would it look like? Here are a few of our finished displays. Well done guys. There were lots of challenges bringing your creative ideas to reality but you persevered and powerfully showed your statistic.


No comments:
Post a Comment